Year 2 · Maths · Statistics · Free Printable

Data and Graphs

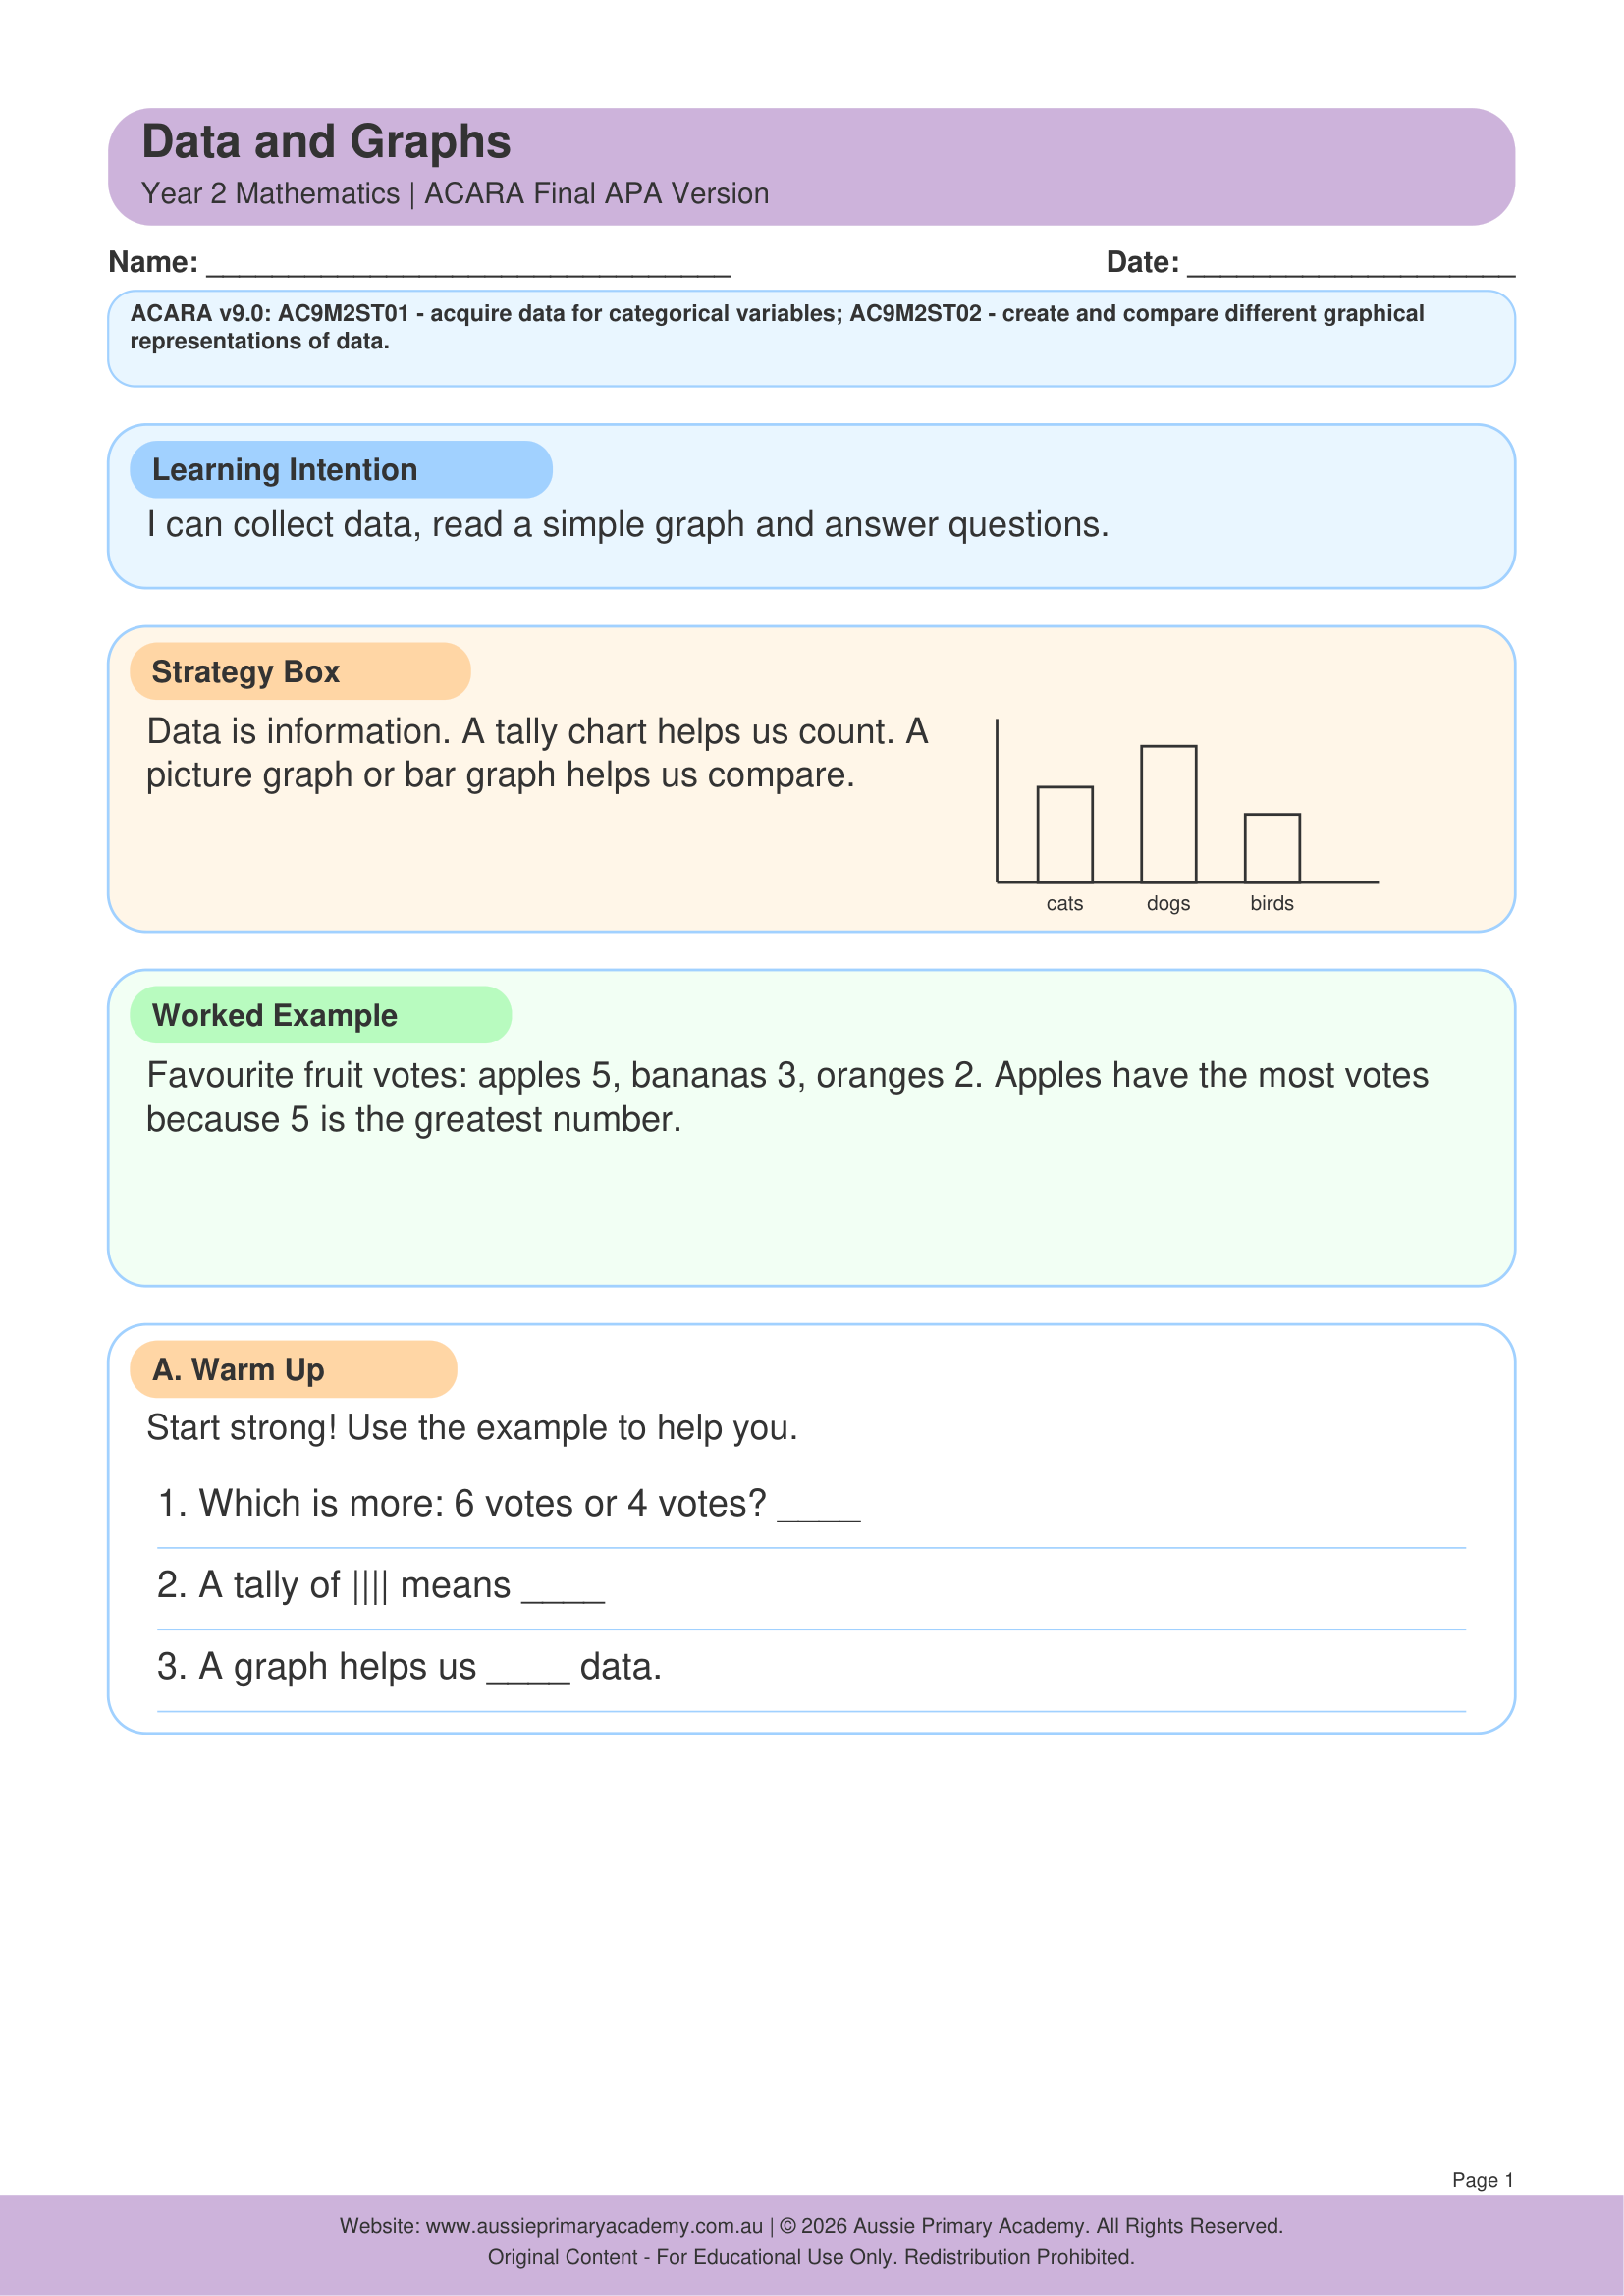
Help Year 2 students collect, organise and interpret simple data using tables, lists and picture graphs.

AC9M2ST01MathsStatisticsAnswer Key Included

Worksheet Preview

year-2-data-and-graphs Preview

Learning Intention

Students will collect simple data and display it in lists, tables and picture graphs, then answer questions about it.

Australian Curriculum

AC9M2ST01

Collect, organise and represent data in lists, tables and picture graphs, and interpret the results.

Teacher Notes

Start with a class survey (favourite fruit, pet, colour). Students can then complete picture graphs and answer simple questions.

Skills Practised

  • Collecting data
  • Picture graphs
  • Reading tables
  • Interpreting information

Reading and Making Simple Graphs

Graphs organise information so that it can be compared quickly. Before answering a question, check the title, labels, categories and scale.

A Simple Check

  1. Read what the graph is about.
  2. Identify what each category represents.
  3. Check how the values are counted on the scale.
  4. Compare the data before stating your answer.

Use mathematical language such as more than, fewer than, most and least. When two categories are close, count carefully rather than relying on the picture alone.

Ask a Question

After reading a graph, create one question that can be answered from the data. This helps children connect graphs with real questions.